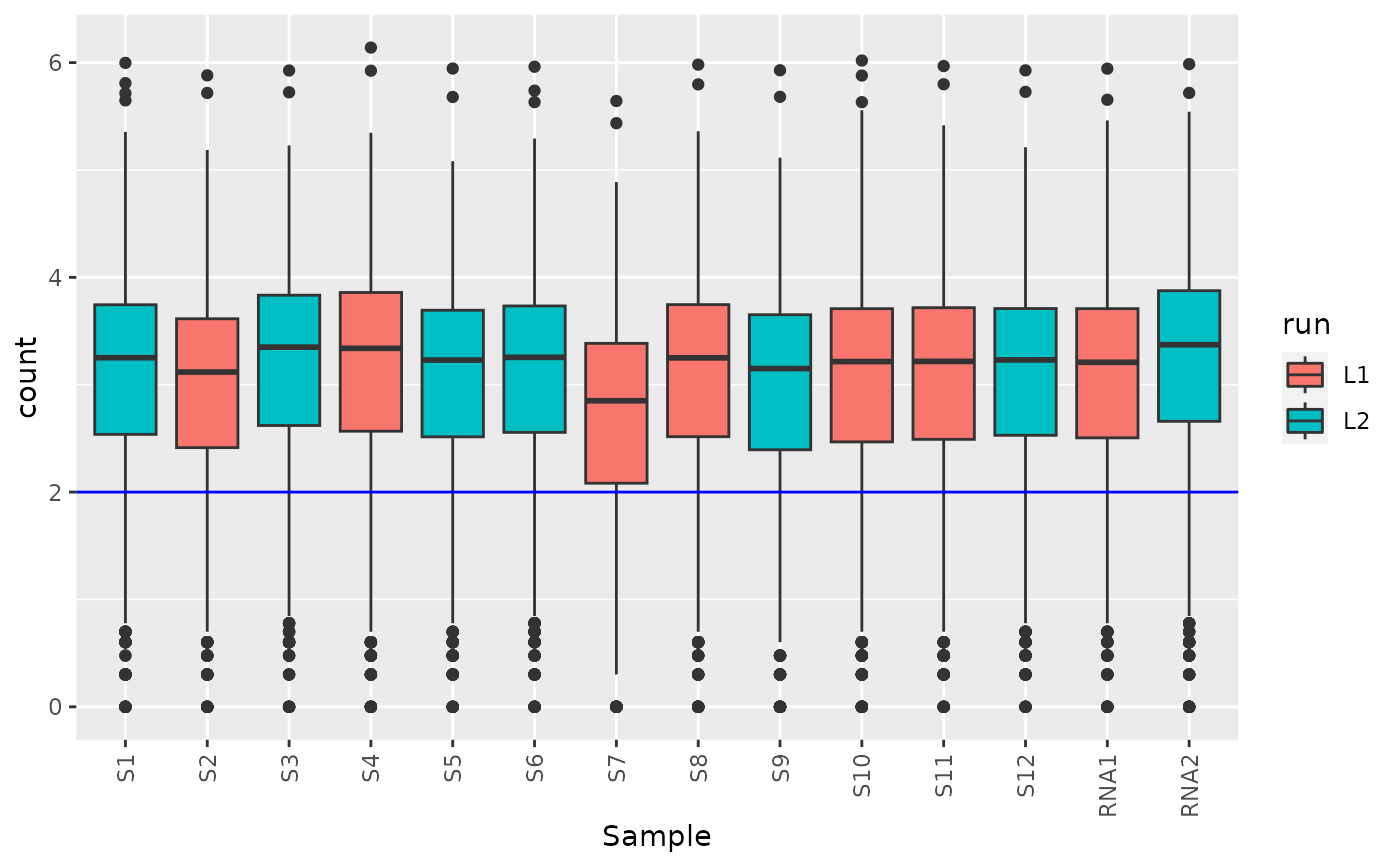
This plot is useful to check if the samples are alike in their raw counts.
Examples
data("ribo_toy")
boxplot_count(ribo_toy,"run")
#> Warning: Removed 499 rows containing non-finite outside the scale range
#> (`stat_boxplot()`).
#> Warning: Removed 499 rows containing non-finite outside the scale range
#> (`stat_boxplot()`).