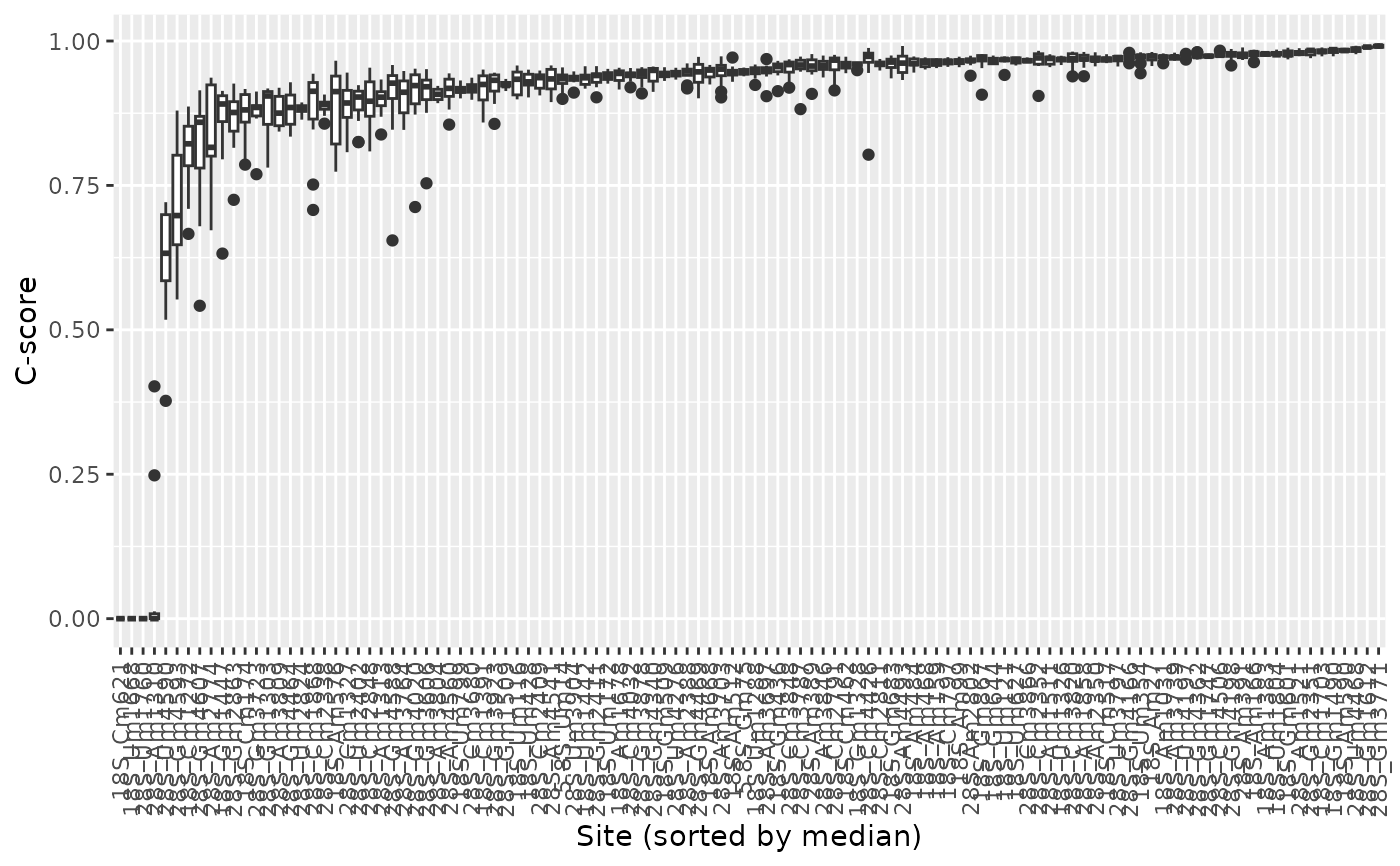
Plot boxplot representing the C-score values of all samples for each individual annotated site Sites are sorted by their median.
Source:R/plot_boxplot.R
boxplot_cscores.RdPlot boxplot representing the C-score values of all samples for each individual annotated site Sites are sorted by their median.
Usage
boxplot_cscores(
  ribo,
  outlier = TRUE,
  sort_by = c("median", "iqr", "var")[1],
  horizontal = FALSE
)Examples
data("ribo_toy")
data("human_methylated")
ribo_toy <- rename_rna(ribo_toy)
ribo_toy <- annotate_site(ribo_toy,human_methylated)
boxplot_cscores(ribo_toy)
#>        site variable    cscore
#> 1  18S_Am27       S1 0.9783333
#> 2  18S_Am99       S1 0.9680204
#> 3 18S_Um116       S1 0.9276274
#> 4 18S_Um121       S1 0.9630216
#> 5 18S_Am159       S1 0.9629730
#> 6 18S_Am166       S1 0.9809492