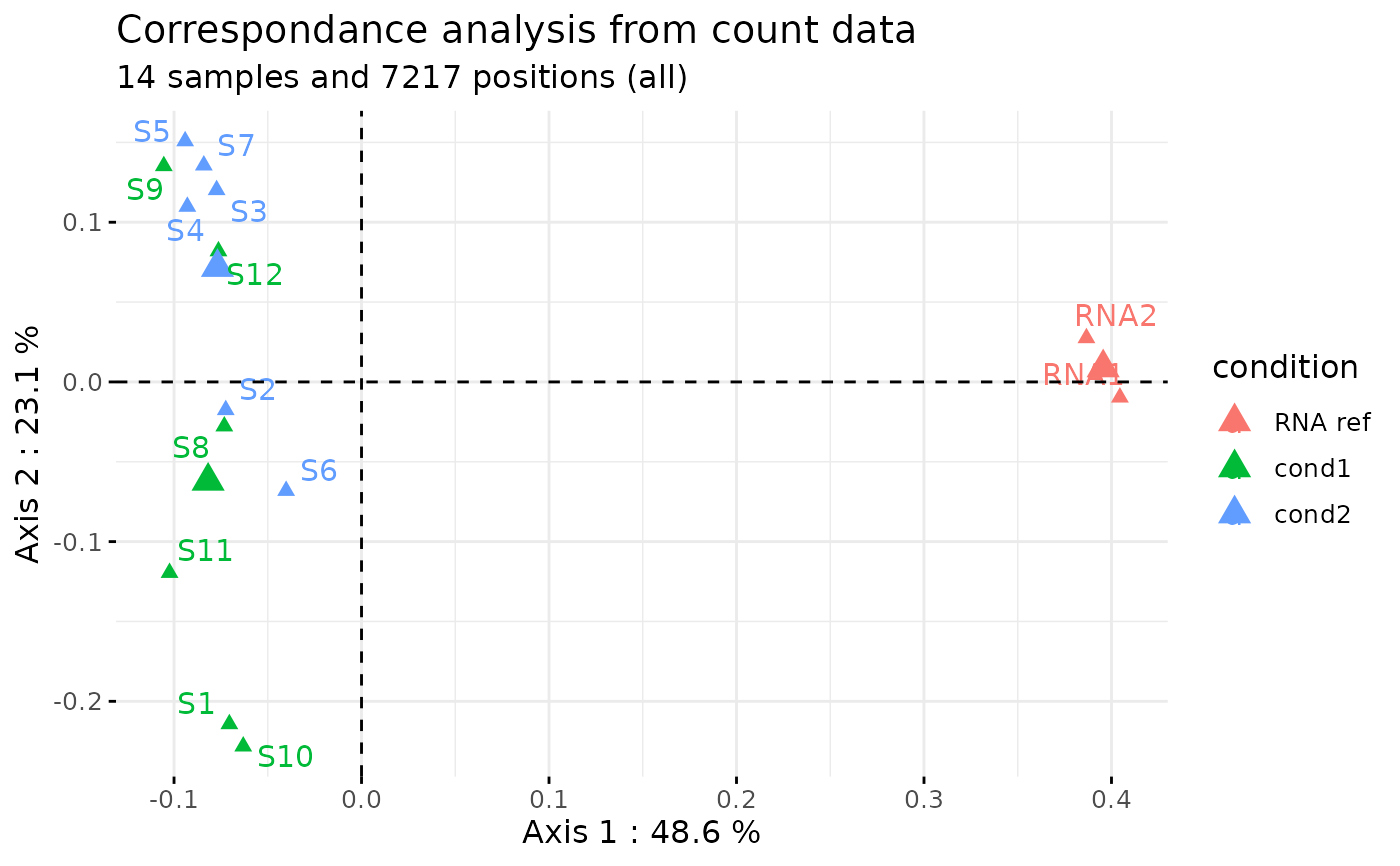
Correspondence analysis of a RiboClass' counts
Usage
plot_coa(
  ribo,
  color_col = NULL,
  axes = c(1, 2),
  only_annotated = FALSE,
  title = "default",
  subtitle = "default",
  object_only = FALSE
)
Arguments
- ribo
A RiboClass object.
- color_col
Name of the column in the metadata used for coloring samples.
- axes
Two-element vector indicating which pair of COA components to show.
- only_annotated
If TRUE, use only annotated sites to plot COA.
- title
Title to display on the plot. 'default' for default title.
- subtitle
Subtitle to display on the plot. 'samples' for number of samples. 'none' for no subtitle.
- object_only
Return directly the full dudi.coa object, without generating the plot.
Examples
data('ribo_toy')
plot_coa(ribo = ribo_toy, color_col = 'condition')