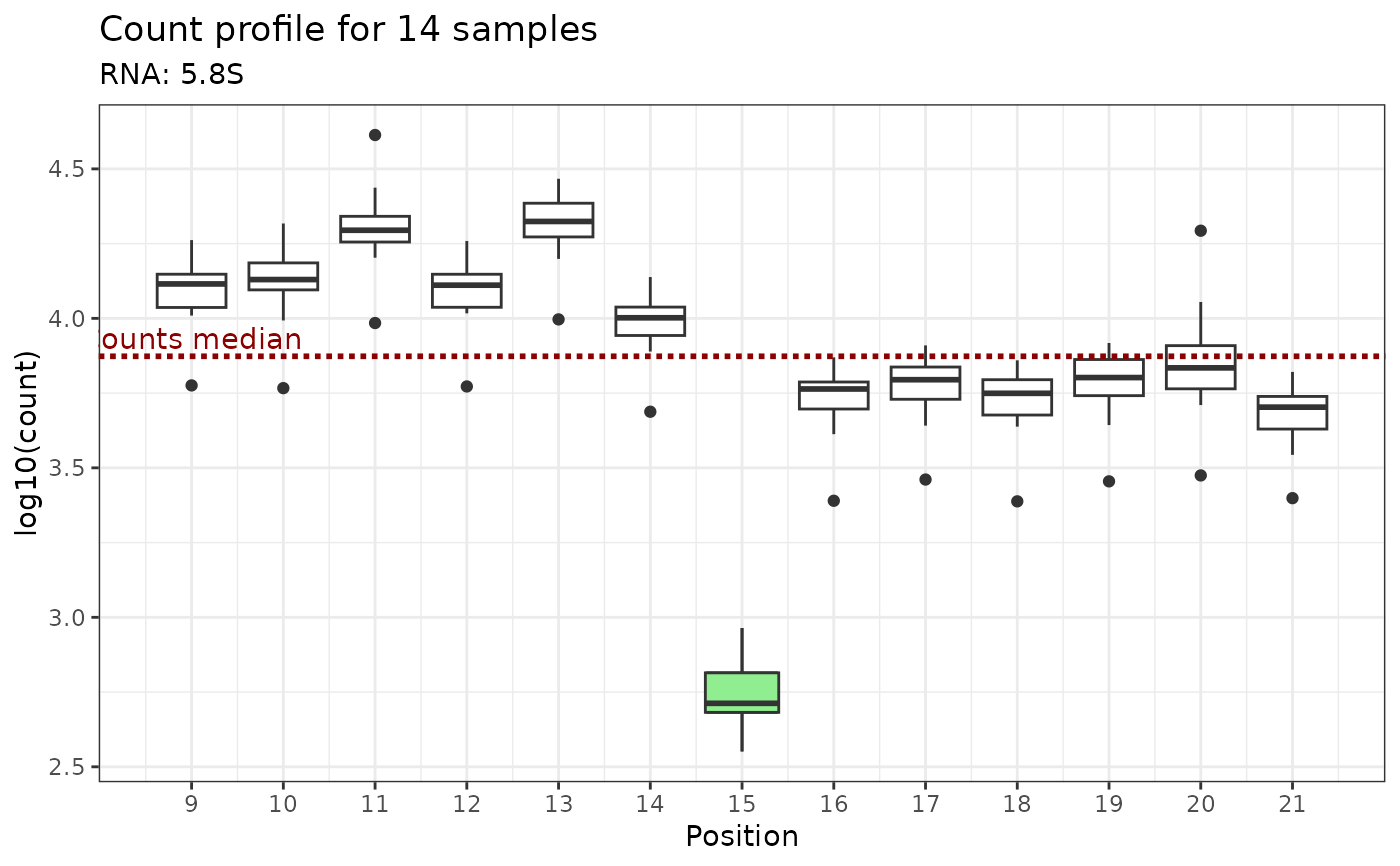
Plot counts for a given position on a given RNA
Usage
plot_counts_env(
  ribo = NULL,
  rna = NULL,
  pos = NULL,
  samples = "all",
  flanking = 6,
  condition = NULL
)
Arguments
- ribo
A RiboClass object
- rna
Name of RNA where the position is located
- pos
Position on RNA on which the view will be centered
- samples
Samples to display. "all" will display all samples.
- flanking
Number of sites to display on the left/right of the selected position.
- condition
Condition column in metadata
Examples
data("ribo_toy")
ribo_toy <- rename_rna(ribo = ribo_toy)
plot_counts_env(ribo = ribo_toy, rna = "5.8S", pos = 15)
