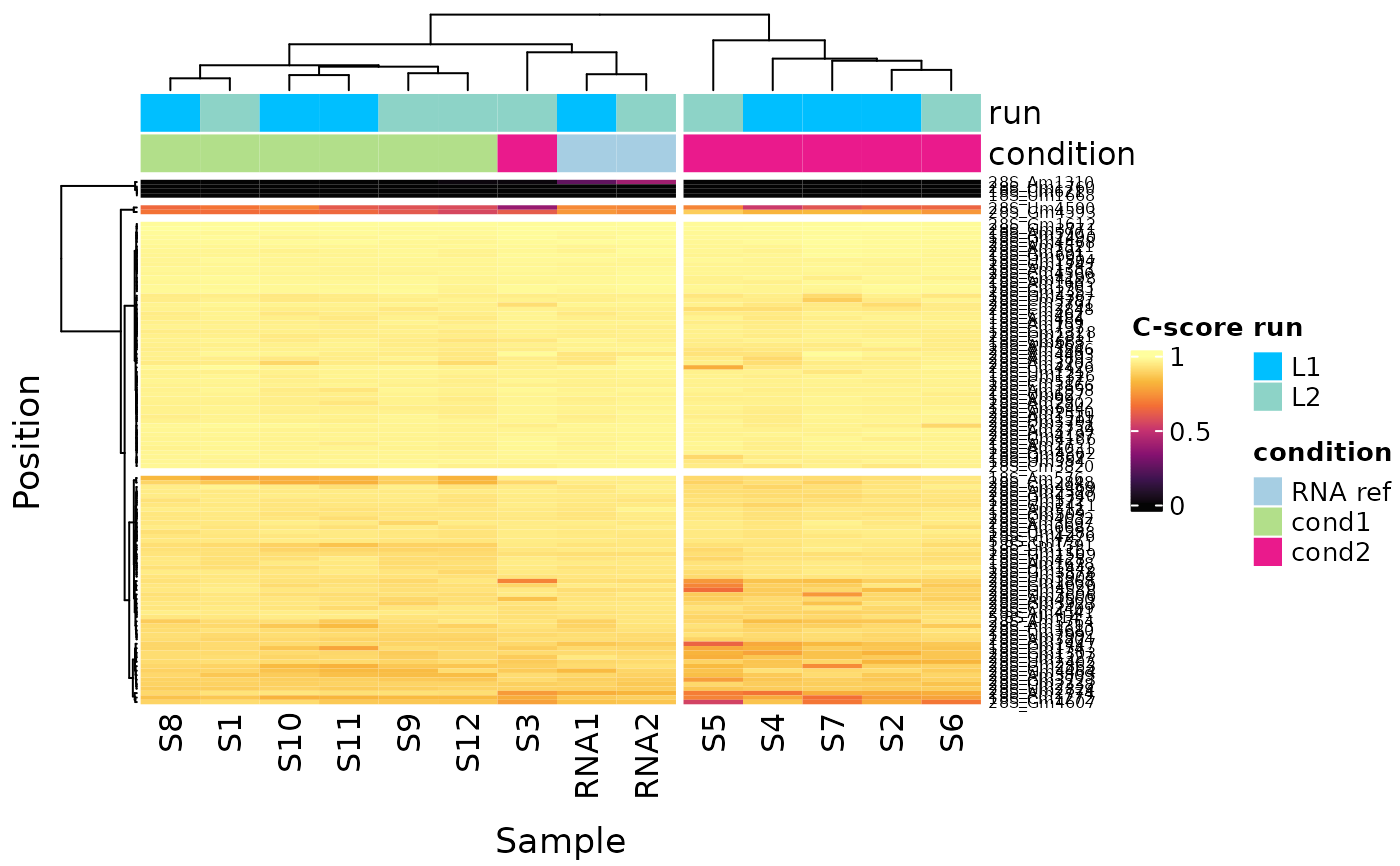
This easy function will let you display an heatmap for any given column (count or c-score). You can add an additionnal layer of information with metadata columns.
Usage
plot_heatmap(
  ribo,
  color_col = NULL,
  only_annotated = FALSE,
  title,
  cutree_rows = 4,
  cutree_cols = 2,
  ...
)
Arguments
- ribo
A RiboClass object.
- color_col
Vector of the metadata columns’ name used for coloring samples.
- only_annotated
Use only annotated sites (default = TRUE).
- title
Title to display on the plot. "default" for default title.
- cutree_rows
number of clusters the rows are divided into, based on the hierarchical clustering (using cutree).
- cutree_cols
number of clusters the columns are divided into, based on the hierarchical clustering (using cutree).
- ...
Pheatmap’s parameters
Value
A ggplot object of a heatmap. The distance used is manhattan and the clustering method is Ward.D2. See ComplexHeatmap doc for more details
Examples
data("ribo_toy")
data("human_methylated")
ribo_toy <- rename_rna(ribo_toy)
ribo_toy <- annotate_site(ribo_toy,
                                annot = human_methylated,
                                anno_rna = "rRNA",
                                anno_pos = "Position",
                                anno_value = "Nomenclature")
plot_heatmap(ribo_toy,  color_col = c("run","condition"), only_annotated=TRUE)