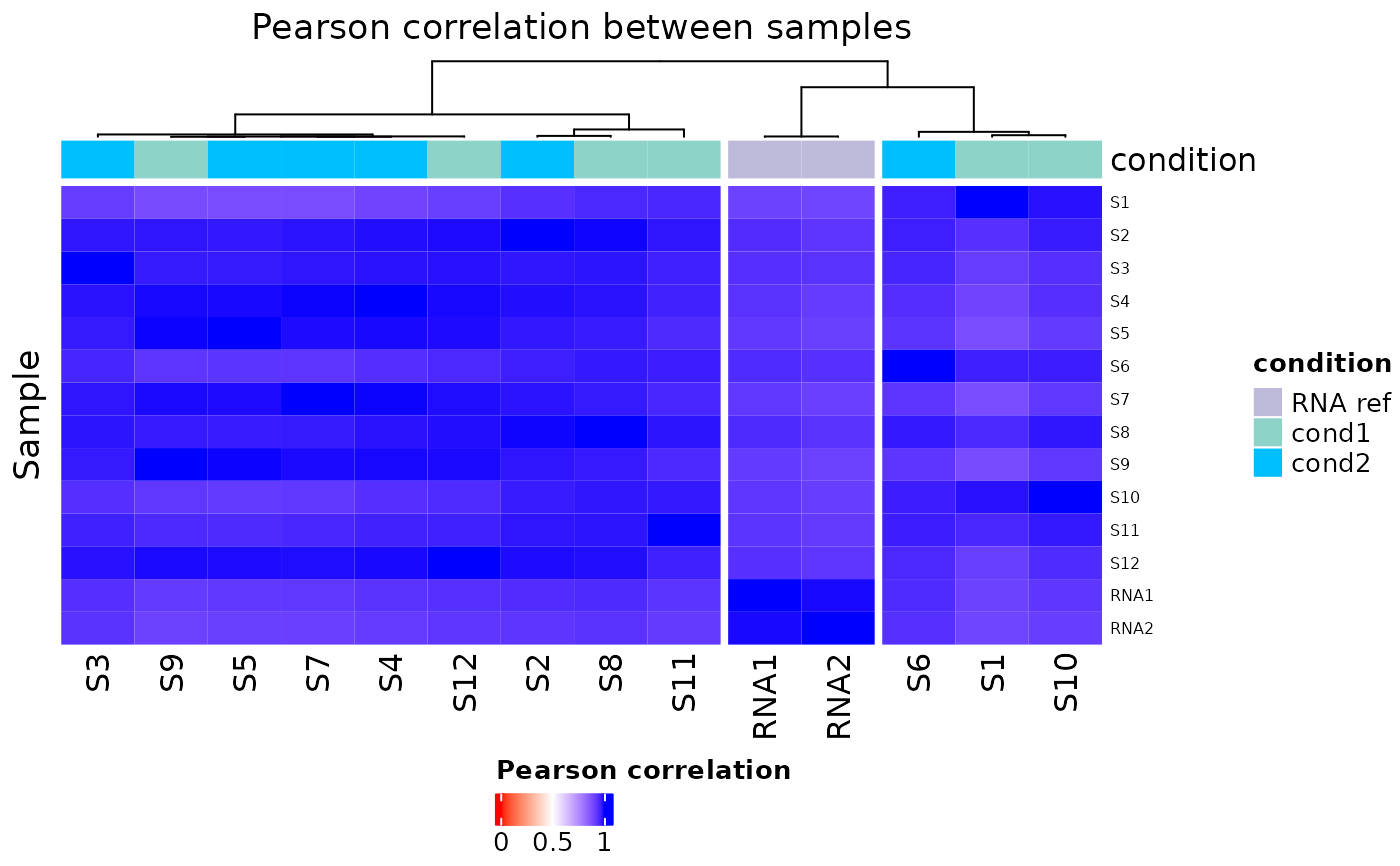
Plot a correlation heatmap from a riboclass object Shows the correlation distance between samples.
Source:R/plot_heatmap_corr.R
plot_heatmap_corr.RdPlot a correlation heatmap from a riboclass object
Shows the correlation distance between samples.
Examples
data("ribo_toy")
plot_heatmap_corr(ribo_toy,"count","condition")