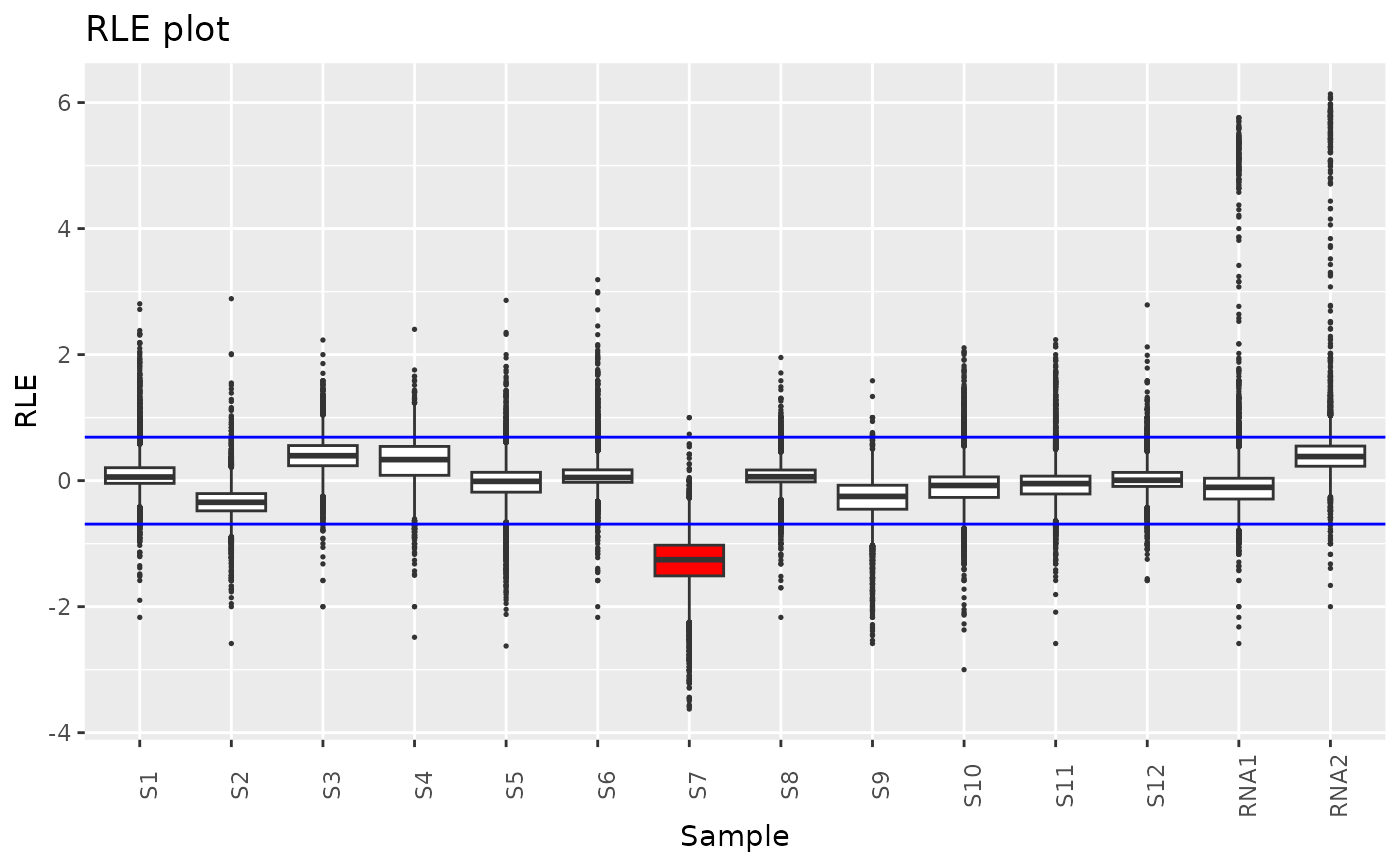
Relative Log Expression plot of a RiboClass object’s counts.
Value
A ggplot object. Samples with a median lower than median(RLE counts)-2*MAD (Median Absolute Deviation) are colored in red.
Examples
data("ribo_toy")
plot_rle(ribo_toy)
Relative Log Expression plot of a RiboClass object’s counts.
A ggplot object. Samples with a median lower than median(RLE counts)-2*MAD (Median Absolute Deviation) are colored in red.
data("ribo_toy")
plot_rle(ribo_toy)