Plot sites in increasing/decreasing order of IQR or variance
Source:R/plot_sites_by_iqr.R
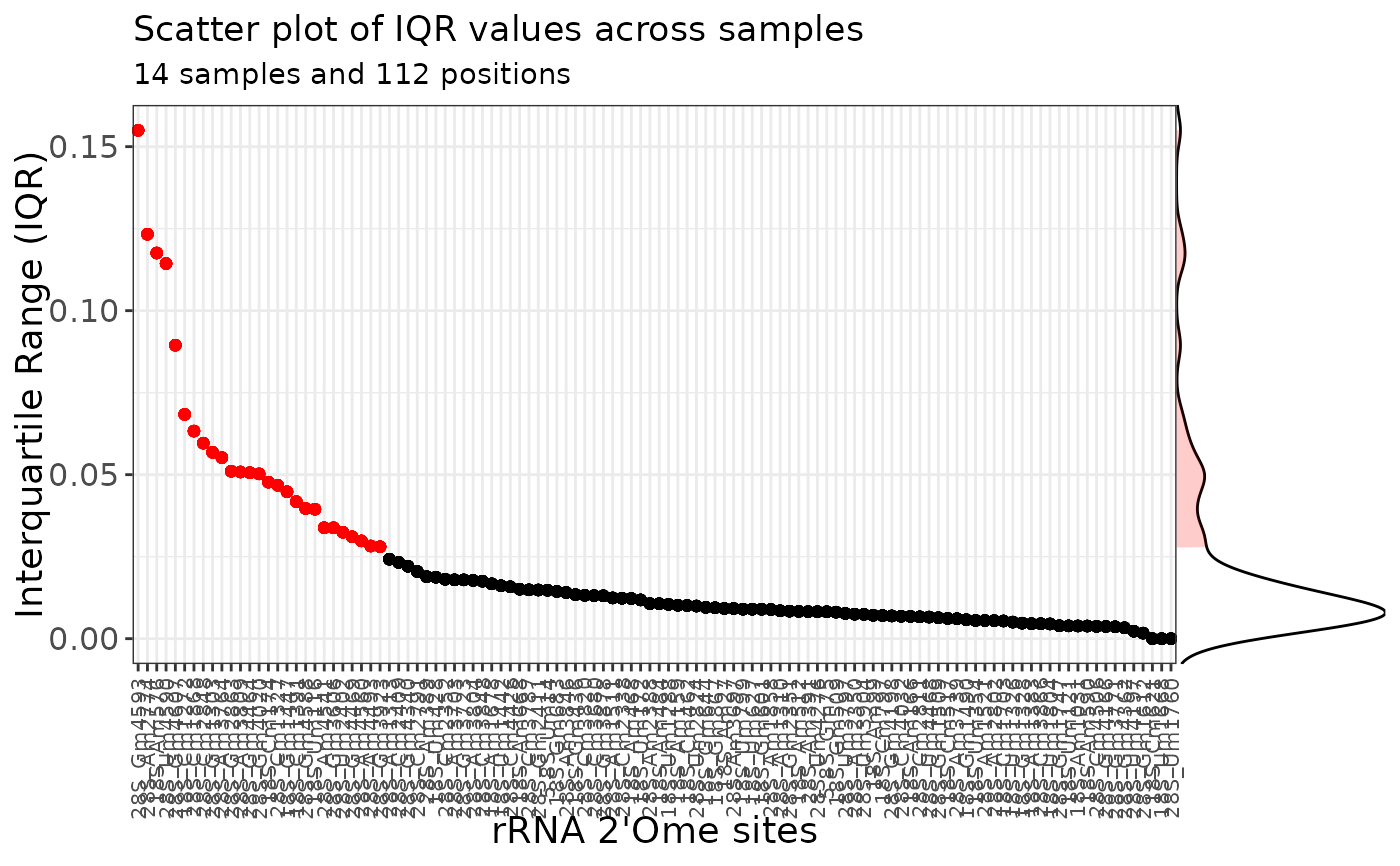
plot_sites_by_IQR.RdThe sites that show an IQR/variance higher than median + 2*MAD are colored in red and are considered as the most variant sites.
Examples
data("ribo_toy")
data("human_methylated")
ribo_toy <- rename_rna(ribo_toy)
ribo_toy <- annotate_site(ribo_toy,human_methylated)
plot_sites_by_IQR(ribo = ribo_toy, plot = "IQR")
#> Warning: `aes_string()` was deprecated in ggplot2 3.0.0.
#> ℹ Please use tidy evaluation idioms with `aes()`.
#> ℹ See also `vignette("ggplot2-in-packages")` for more information.
#> ℹ The deprecated feature was likely used in the rRMSAnalyzer package.
#>   Please report the issue at
#>   <https://github.com/RibosomeCRCL/rRMSAnalyzer/issues>.
#> Ignoring unknown labels:
#> • size : "20"
#> Ignoring unknown labels:
#> • size : "20"